TSViz
The TSViz visualization engine generates interactive communication graphs from execution logs of complex multi-threaded systems.
What am I looking at?
In the visualization:
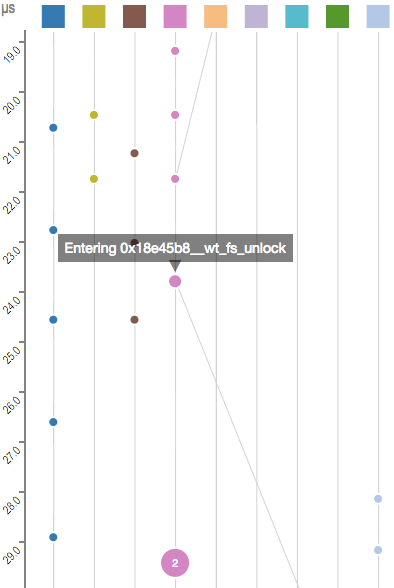
- Time flows from top to bottom.
- The left panel shows the log and the middle panel displays a DAG of the partially ordered vector timestamps recorded in the input log, the events in this DAG are placed to scale relative to each other according to physical clock timestamps in the log.
- A vertical line with a box at the top is a thread timeline representing a single thread of execution. Each thread is associated with a color.
- Circles on a thread timeline are events that were executed by the thread.
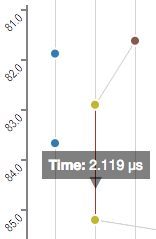
- Diagonal lines connecting two events represent the happened-before relation between the events: the higher of the two events happened before the second event.
- Dashed lines represent transitive communication edges. These only appear when a thread is hidden, and two threads that are not hidden communicated indirectly through this thread.
- Larger circles represent merged local events. These have a number inside of them, indicating the number of events that they represent.
- Radiating lines that fade out represent communication edges to threads that are currently hidden from view.
How do I interact with the visualization?
The visualization supports the following actions:
-
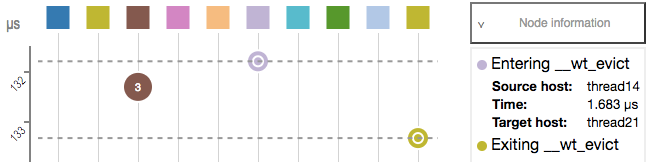
Show thread name or event info
Click on a thread box or an event circle. -
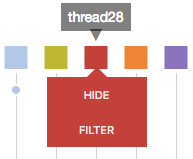
Hide a thread timeline
Click a thread box and select "hide". This will remove the thread and its timeline from view. You can hide more than one thread. -
Filter by communication to thread(s)
Click a thread box and select "filter". The graph will be filtered to show only those threads/events that communicate with the filtered thread. You can filter by more than one thread. -
Expand/collapse non-communicating events
TSViz collapses adjacent thread events not incident on any communication edges into larger circles. Click on one of these nodes and select "expand" to undo this collapsing. -
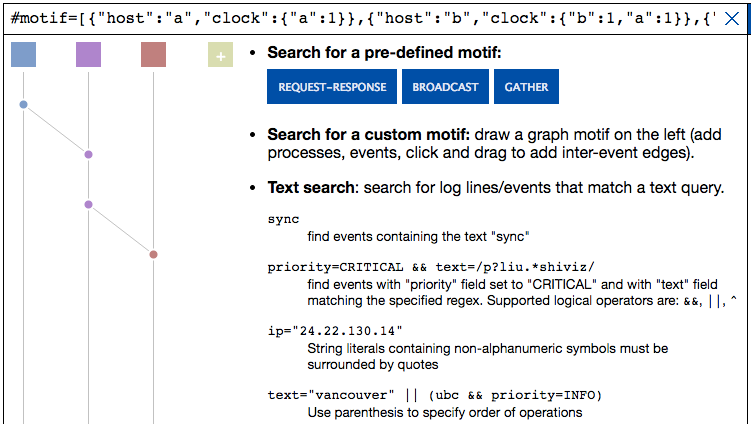
Search for keywords or subgraphs
TSViz supports keyword search across the parsed fields. Search supports logical connectives and regular expressions. You can also search for subgraphs or communication topologies of interest. You can search for a pre-defined structure like broadcast or request-response, or you can define and search for a custom structure. -
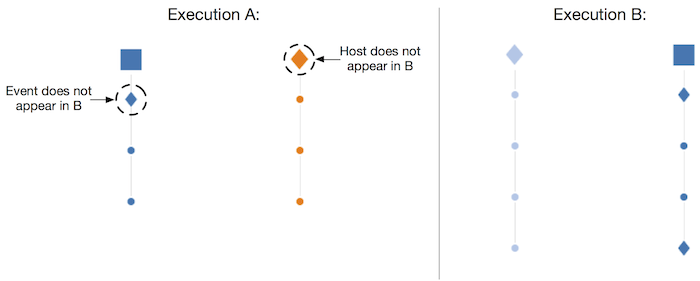
Show and hide differences between executions
When viewing two executions side-by-side, click on "show differences" to highlight the differences between two executions. Hosts that are not common to both executions are represented as rhombuses. Threads present in both executions have their events compared by theeventcapture group. Different events are drawn as rhombuses. -
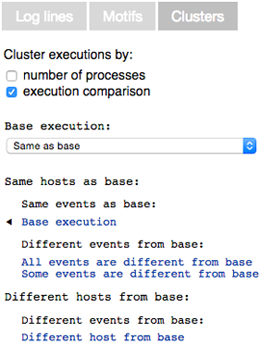
Explore execution clusters
For logs with multiple executions, click on the "clusters" tab to separate executions into different groups based on a chosen metric. Cluster by the number of threads to group executions by the midpoint between the smallest and largest number of threads. Cluster by execution comparison to see an overview of how executions differ from a selected base. -
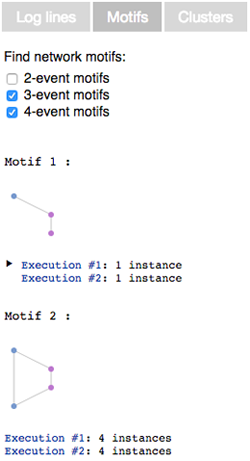
Search for network motifs
Click on the "motifs" tab to find frequently occurring communication patterns within and across executions. Search for 2, 3 or 4-event motifs that occur in at least 50% of the executions or that appear at least 5 times within a single execution.
How is this tool useful?
Here are four use-cases that TSViz helps to support:
-
Performance debugging.
Understand the how long events took to execute. TSViz orders events to scale across threads using physical clock timestamps in the log. -
Reason about ordering in a concurrent setting.
Visualize concurrency and the happened-before relation to understand if two events occurred concurrently, or if one happened before the other. -
Analyze activity at threads that matter.
Hide threads (and their log lines) for a more focused visualization. Filter by communication to a thread to see only those events at other threads that were likely to have influenced the execution of a thread you care about. -
Execution comparison and
differencing
Use TSViz to thread logs containing multiple executions. Compare executions pairwise, side-by-side. Use TSViz to highlight event and host differences between two executions to understand where the executions diverge.
What is the input log format to the tool?
(Also, see the LogFormat wiki page.)
You can specify the log format using a regular expression on the Input page. The regular expression must contain the following three named capture groups:
timestamp: the physical clock timestamp of the eventevent: the description of the eventhost: the name of the thread, thread, or host that executed the eventclock: the vector clock associated with the event, in JSON format
You can also specify other capture groups other than event to capture fields (such as date, IP, priority) which are shown in the sidebar while hovering over an event in the visualization. These fields, unless sub-groups of the event group, will not be displayed as part of the event message.
For example, to parse log entries like this one:
1456966522871394967 Exiting eviction_wait_handle.0x18988c0__wt_spin_unlock
thread4 {"thread4":58}
We would use the following parser RegExp:
(?<timestamp>(\d*)) (?<event>.*)\n(?<host>\w*) (?<clock>.*)
The capture groups in TSViz is not standard regexp syntax. We recommend using a plain JS regexp tester with regular capture groups to develop expressions, and name the capture groups afterwards.
How can I generate logs to use in TSViz?
You can study the execution of any system that produces logs in a format that can be parsed using the RegExp mechanism above.
We recommend DINAMITE instrumentation tool that outputs TSViz-compatible logs.